Imaging volcanic geothermal systems
Electrical resistivity is a crucial geophysical parameter in geothermal exploration as hydrothermal and magmatic reservoirs are typically related to low resistivity zones, which can be easily sensed by magnetotellurics (MT). EPM group has carried out a number of surveys aimed at high-resolution imaging of the geothermal systems.
Imaging high-enthalpy geothermal system in East African Rift
The project is a collaboration between ETH scientists from the Earth and Planetary Magnetism Group, Geothermal Energy and Geofluids Group (Dr. Friedemann Samrock) and external pageReykjavik Geothermal Ltd. from Iceland.
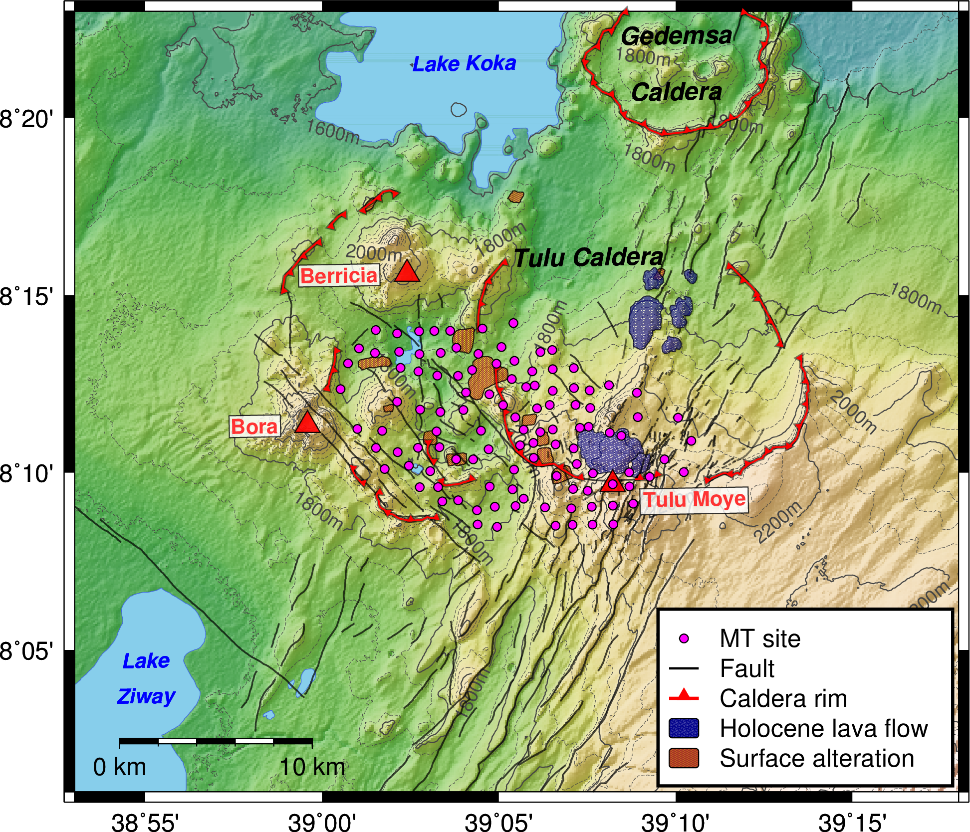
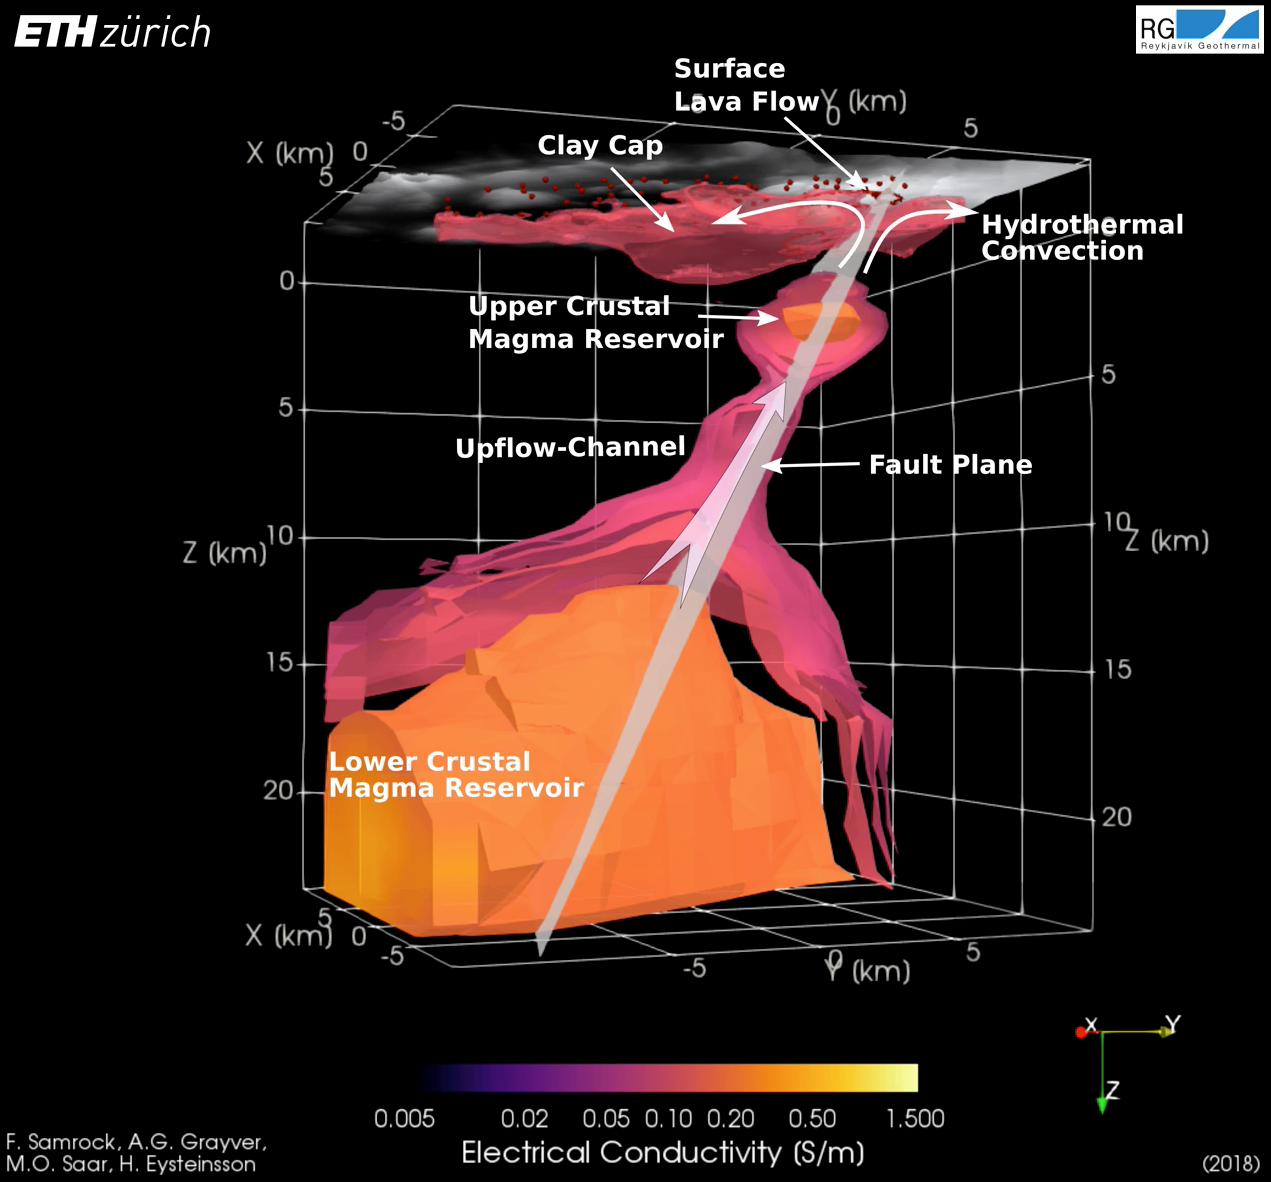
For this project we analyze MT data that were collected at more than 100 stations by Reykjavik Geothermal at the Tulu Moye geothermal field in Ethiopia. The survey area is located between the lakes Ziway and Koka and witnessed a long history of volcanism. The Tulu Moye geothermal prospect has an estimated external pagepotential for power production that exceeds 500 MWe.
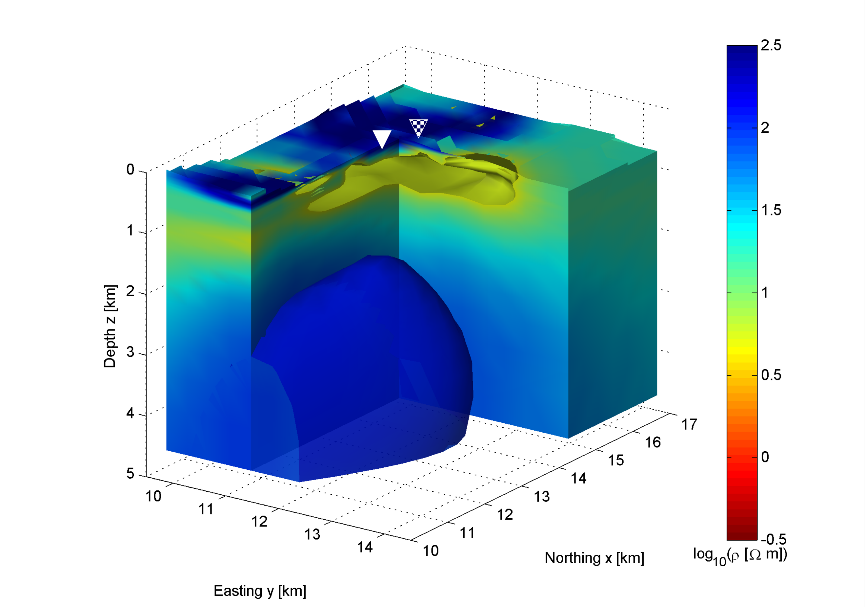
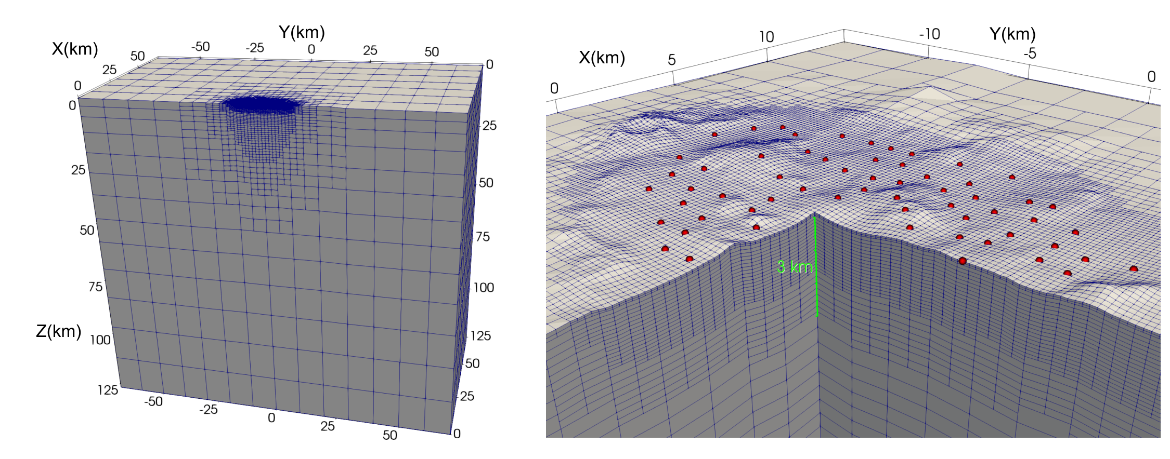
For the study we use numerical modelling tools that were developed by Dr. Alexander Grayver in order to invert the MT data for 3-D subsurface electrical conductivity structure. The tool has implemented meshing algorithms that can handle rough topography and complex geological structure as typically found in volcanic regions.
The results from our study of the Tulu Moye data show that our approach allows us to image the entire underlying magmatic and superimposed hydrothermal system. This leads to an improved understanding of manifold volcanic and hydrothermal processes, such as melt storage and transport and the formation of convective hydrothermal systems.
Analysis and interpretation of MT data from the Aluto-Langano geothermal field, Ethiopia
MT measurements were carried in early 2012 in order to identify the source of reoccurring uplift and setting below Aluto. Broad band MT data have been acquired at 46 sites covering the expanse of the Aluto volcanic complex with an average site spacing of 1 km.
Based on this MT data it is possible to map the bulk electrical resistivity of the subsurface down to depths of several kilometers.
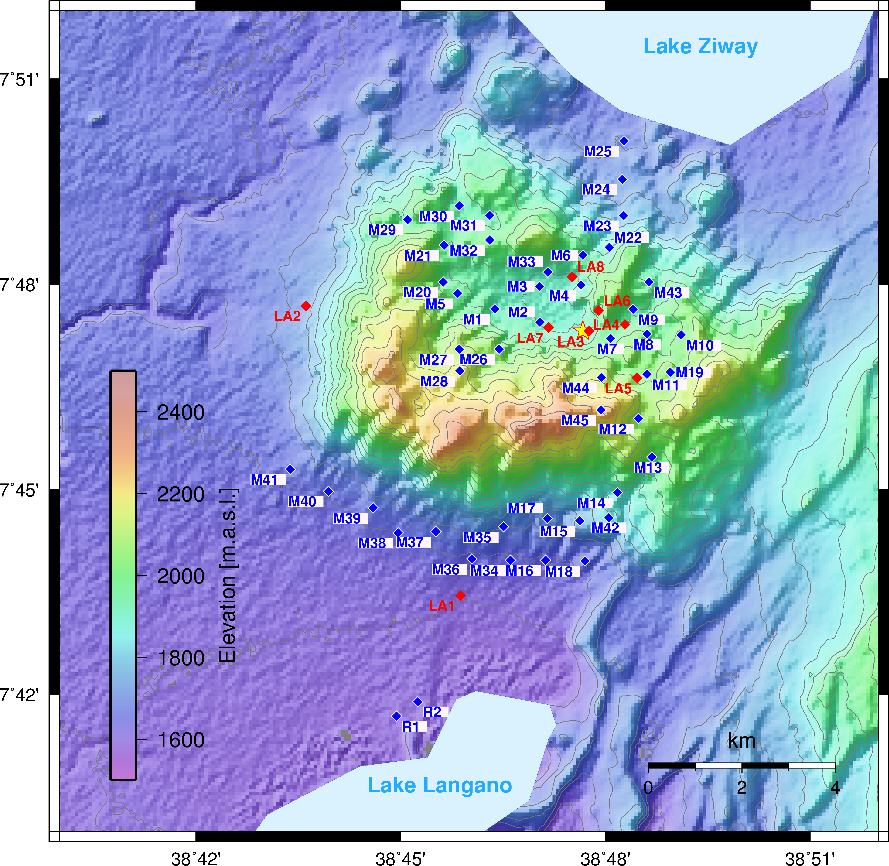
3-D inversions of the observed MT data from Aluto using revealed the typical electrical conductivity distribution of a convective high enthalpy geothermal system, which is mainly governed by the hydrothermal alteration mineralogy: an electrically highly conductive clay cap is situated on top of the more resistive formation. The recovered 3-D conductivity model provide no evidence for an active and thus electrically conductive magmatic system under Aluto. This implies that the deforming source is most likely situated within the shallow hydrothermal system of the geothermal field.